Outline the project — get the timeline, fast
Enter phases, dates, and categories, and Vizionary turns them into actionable charts, labeled and ready for class.
Why Choose Vizionary
Project-smart by default
Auto-builds Gantt charts, marks milestones, flags overlaps/schedule drift.
Learn while you visualize
Inline tips for PV/EV/AC, CPI/SPI, and time-boxing.
Presentation-ready
Clear labels/captions, accessible colors, one-click PNG/PDF exports.
Top 3 Use Cases
From project management to personal productivity and budget tracking
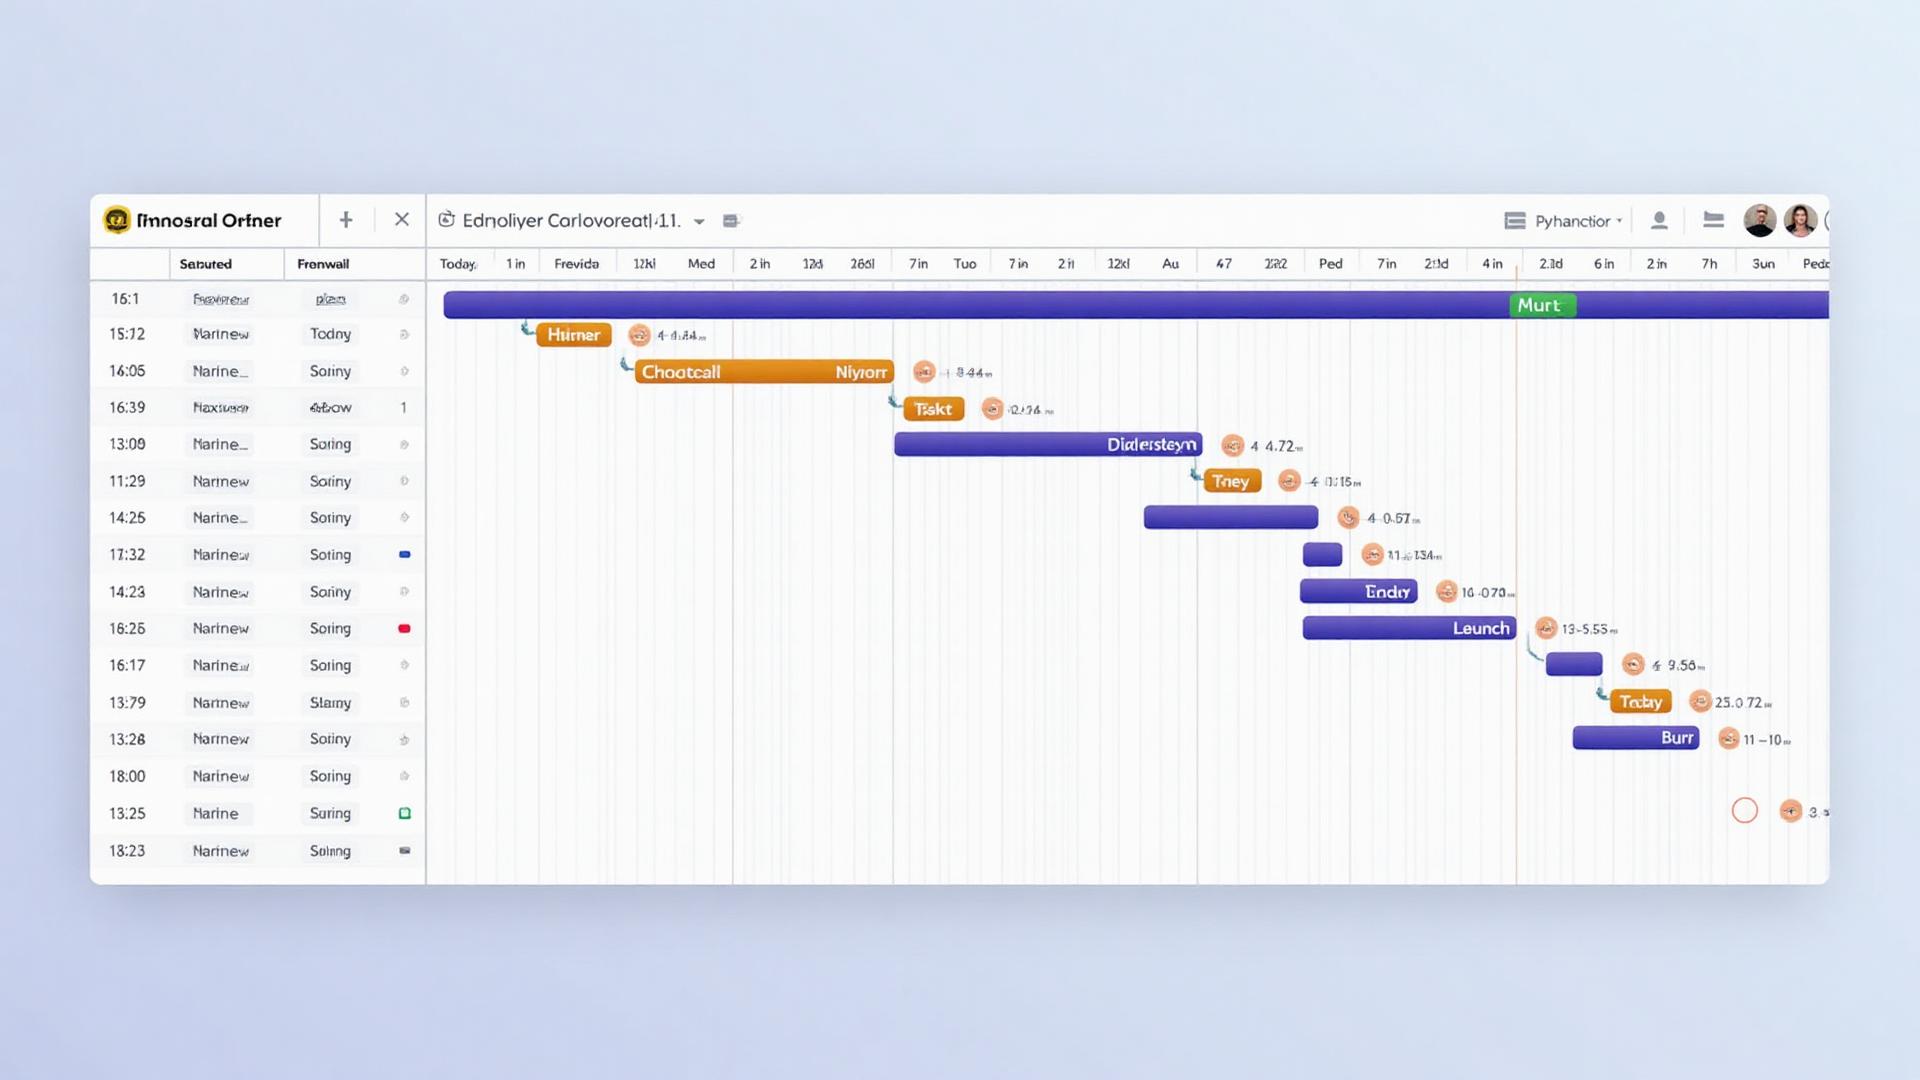
Project phases timeline (Gantt)
Define start/end dates; see milestones, "Today" line, overlap/slippage callouts.
Daily time allocation (personal productivity)
Enter categories & minutes; see day breakdown vs. target plan.
Budget vs. Actuals / Earned Value
Plot PV, EV, AC; auto-compute CPI/SPI with variance annotations.
From plan to picture— show your project like a PM
No credit card. Works with CSV or copy-paste tables. Exports in one click.
